The Plantex by Plant-Prod Nutrient Specification Wallchart – How to Use

Selecting the correct fertilizer and achieving the correct concentration is easy once you have done it a few times, but at the start it can be confusing. The Plantex® wallchart is a helpful resource. At first glance the numbers can look overwhelming. However, it is simple to use if you go one step at a time. Here are five steps:
1. Test the soil & water
In order to maximize productivity, the first step is to conduct a soil and water analysis. Testing services are available – often at no charge. The result will help you ensure the soil pH is suitable for your crop and that there are enough, but not too much, of each nutrient.
2. Select the best fertilizer for the crop & soil conditions
Go to the crop sheets on the Plant-Prod website and see recommended feeding rates. For example, let’s say you need to fertilize orchids. You can use Plantex 24-8-16 Foliage; however, this formulation does not contain calcium or magnesium. To ensure high flower count and maximum flower size, Plantex 24-8-16 Foliage should be alternated with Plantex 12-2-14 Cal Mag +P. On the side of the chart that lists nutrient concentrations you can compare the composition of nutrients in each formulation.
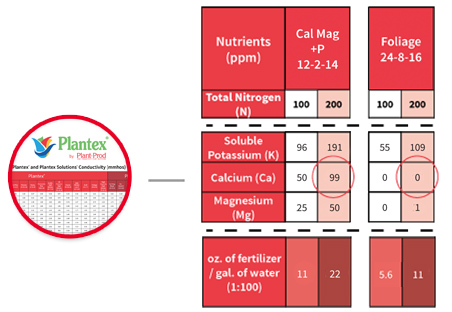
This shows that when 22 oz. of fertilizer is diluted in 1 gallon of water, Cal Mag +P provides 99 parts per million (ppm) of calcium, compared to zero from Foliage.
3. Mix the fertilizer with water
You can see from the orchid crop sheet that the desired level of fertilization of nitrogen (N) is 200 ppm. To feed at this rate using a 1:100 injector ratio, 22 oz. of fertilizer should be mixed in 1 gallon of water.
You may notice that some products, such as Plantex Solutions 17-5-17 Complete, come in a patented duo bag that require use of the entire bag at once. For these products, the amount of water is on the bag label or can be calculated using the amount shown at the bottom of the product column, as follows:
25 lb x 16 ÷ 15.7 = 26 gallons of water
4. Check the conductivity
To check that the solution is not excessively diluted or concentrated, its electrical conductivity (EC) should be checked using an EC meter.
The EC chart can be used to measure accuracy of your fertilizer injector system by following these steps:
1. Take an EC reading of clear irrigation water
2. Take an EC reading of final fertilizer solution
3. Subtract the EC reading of clear water from the EC reading of the fertilizer solution
Example:
Conductivity of water is 0.50 mmhos
Conductivity of the fertilizer solution is 2.18 mmhos
The conductivity due to the fertilizer is 2.18 mmhos – 0.50 mmhos = 1.68 mmhos
For Plantex 12-2-14, an EC reading of 1.68 mmhos corresponds to a feeding rate of 200 ppm of nitrogen.
5. Find the correct conductivity on the chart
On the side of the chart that lists conductivity (mmhos), find the formulation along the top row, then look up the desired level of nitrogen in ppm in the far left column. If the EC meter value is too high, add more water. If it is too low, add more fertilizer.
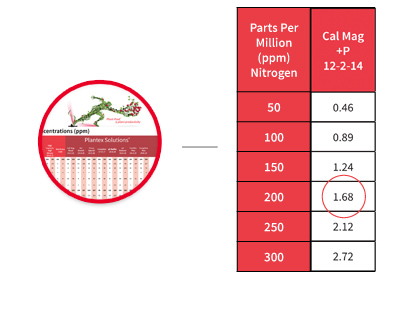
The ppm is shown in the left column. For Cal Mag +P at 200 ppm, a measured EC should be 1.68 mmhos.